|
|
The SPARC simulator, tkisem, is a program that provides a graphical user interface via X-windows. This will make it easy for you to interact with the program which is running on titanic even if you're somewhere else on the internet (like on a PC in the labs), but you must have X-Windows running on your local machine so that tkisem can display things on your screen.
NEW (tested August 1, 2013)
To run tkisem on titanic and cause it to display on your lab PC you
need an SSH connection to titanic plus an X11 display server running
on your desktop. If you configure your SSH session to forward X11
traffic back to your X11 server then all graphical applications
(X11 clients) will render on your local screen.


1. Launching an X11 Server

- open "Xming" from the Windows Start Screen
- the Xming icon will appear in the SysTray and await incoming display requests


2. Opening an SSH connection to TITANIC with X11 forwarding enabled

- open Putty from the Windows Start Screen
- specify the destination Host Name as: titanic.science.mq.edu.au
- under "Connection -> SSH -> X11" tick the "Enable X11 forwarding" check box.
- (optional) save the session for reuse later under "Session" by giving
the session a name in "Saved Sessions" box and clicking "Save".
- click "Open" and then login to titanic using your OneID

3. Launching Tkisem

- at the titanic command prompt (in the putty window you just opened) type:

  tkisem &

This will start the application as a background process (because of the &)
and if all is well tkisem will run and the X11 display traffic will be
forwarded to your desktop (via putty) where it will be rendered by Xming
and you will be presented with the tkisem user interface.
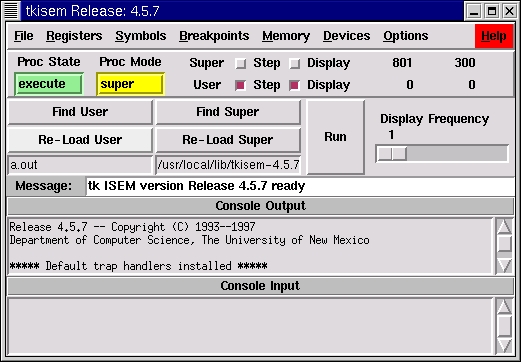
Now that you have run Isem by typing
tkisem &
at the prompt. The following simulator window should appear:
|
|
Notice the ampersand & symbol after the tkisem command - it's optional. It simply tells your shell to run the program in the background, meaning that you can continue to enter commands into the same X-terminal while Isem runs.
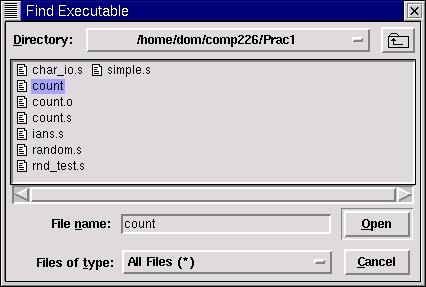
To see how the simulator works, you'll first need to load a user program into it. Before doing this, copy the files in the examples directory into your own home directory on Titanic. Now click the "Find User" button and the following file dialog box should appear
|
|
navigate to the sub-directory into which you copied the practical files, select the executable file count and click "Open". Having done this, the "Message" field in the main window should now say "count loaded into user memory" - you're now ready to run the count program (which does no more than count from 0 to 0x50 in hex)!
Try clicking the "Run" button once, you'll notice that not very much happens, about the only visible change is that the "Message" field clears and the numbers on the line just above the "Run" button change. What has happened is that the simulator has run a single machine code command in the count program and paused. Hitting "Run" again will execute the next machine code command and so forth.
The numbers which are changing above the "Run" button as you do this simply count the number of machine code commands executed so far and the number of memory accesses those commands have performed in the process.
To run the whole program to completion, first un-set the radio button labelled "Step" on the "User" line just above the "Run" button. Now hitting "Run" will execute the whole program, print the numbers 00000000 to 00000050 (hex) on separate lines in the "Console Output" box and exit.
If you wish to go back to the beginning and re-run the whole program (or step through it again) then simply hit the "Re-Load User" button, which will return you to the state the simulator was in when you first loaded the program.
Well, if all you could do was run a program then using this simulator would all be a little un-edifying. There are a number of ways that you can snoop on the SPARC processor as it goes about its business:
The "Registers" window, displays the processor's various general purpose and status registers as the program executes. This is obtained by selecting the "Display" item from the "Registers" menu and produces a window which looks like this:
|
|
The various items displayed here are:
|
Register |
Description |
|---|---|
|
PC |
The Program Counter, which points to the instruction that is about to be executed. |
|
nPC |
The Next Instruction Pointer, which points to the next instruction to be executed. |
|
%r0-%r31 |
The general purpose registers, each of which can contain a 32 bit integer. In fact the term "general purpose" is a little miss leading, since some groups of these registers are used for specialised tasks. For instance, %r0 always contains the number 0, regardless of the operations we perform on it. |
|
Y |
A register used for storing the "overflow" produced by arithmetic operations such as multiplication. |
|
PSR |
The Processor Status Register, it is in this register that the processor records the status of the last operation it performed. In particular the bits marked n, z, v and c indicate whether the last operation delivered a negative or zero result, overflowed or resulted in a carried digit. |
One other useful field in this
display is the "Next Instr." field which displays the
assembly code of the instruction currently pointed to by the program
counter PC.
Watching the contents of his window update as a program runs can provide a programmer with a great deal of information about how his or her program is executing, a well as providing you with a useful way of observing the precise behaviour of each SPARC command that you use.
Incidentally, if you want to modify the contents of (almost) any of these registers you can do so by clicking on the register you're interested in, typing the value you want to give it into the box to the left of the "Set" button and clicking "Set".
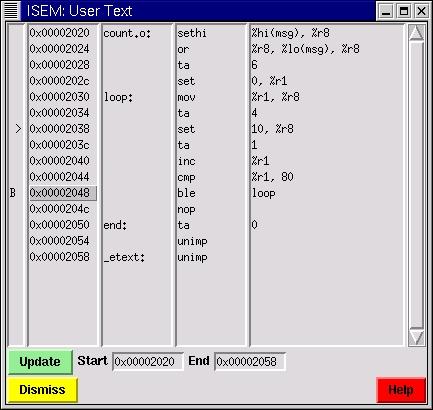
The "User Text" Window, which displays the code of the user program in assembly mnemonic format. You open this window by selecting the "User Text" item in the "Memory" menu of the main window, which should produce a window that looks something like:
|
|
When you first open this window it will actually be empty, however clicking "Update" will fill it with the code you see above. "Update" should also be clicked whenever you load a new executable.
The caret symbol > in the left had column indicates the instruction at which the program counter currently points. This will move as the program executes.
The B symbol in that same column denotes a "breakpoint". When the program is run (assuming that you'd turned off single stepping) then it will run until it reaches the breakpoint-ed instruction, allowing you to inspect registers at that point, and see what is going on, or single step from there onwards. Breakpoints are set and un-set by clicking in the second column of the "User Text" window on the line at which you wish to pause.
Unfortunately, the "User Text" window sometimes gets a little confused and displays the program counter caret and breakpoints on the wrong lines. Luckily, this can always be rectified by pressing the "Update" button.
The "User Data" Window, which displays the data stored in the data segment of your executable. This is obtained by selecting the "User Data" item from the "Memory" menu and produces a window which looks like this:
|
|
Here the second column displays the data in the data section of the executable in hex format whereas column three shows the same data as characters.
Have a look at the help file for Isem, by pressing the "Help" button on any of its screens - surprisingly its actually quite informative!